

Favorites and underdogs month by month: the summer anomaly
Favorites vs underdogs month by month since 2010, best of 3 only. The end of the season shows nothing, but July and August break the usual pattern.


After the US Open and last week's Davis Cup, the last part of the season starts. On Wednesday two ATP 250s start in China, Chengdu and Hangzhou, and on Friday the Laver Cup begins in London.
So I wanted to check if there is any strange pattern in this last part of the year. Physical tiredness and injuries, maybe?
I looked at how favorites and underdogs perform in every month of the year, since 2010, with Pinnacle closing odds and flat stakes. The results withunit impact is very similar.
I removed the Grand Slams. As I have said many times, Slams are a different world. Best of 5 sets makes the gap between favorites and underdogs bigger, and the favorite-longshot bias is much stronger. For betting, always keep best of 3 and best of 5 apart. So everything here is best of 3 only.
And these are the results:
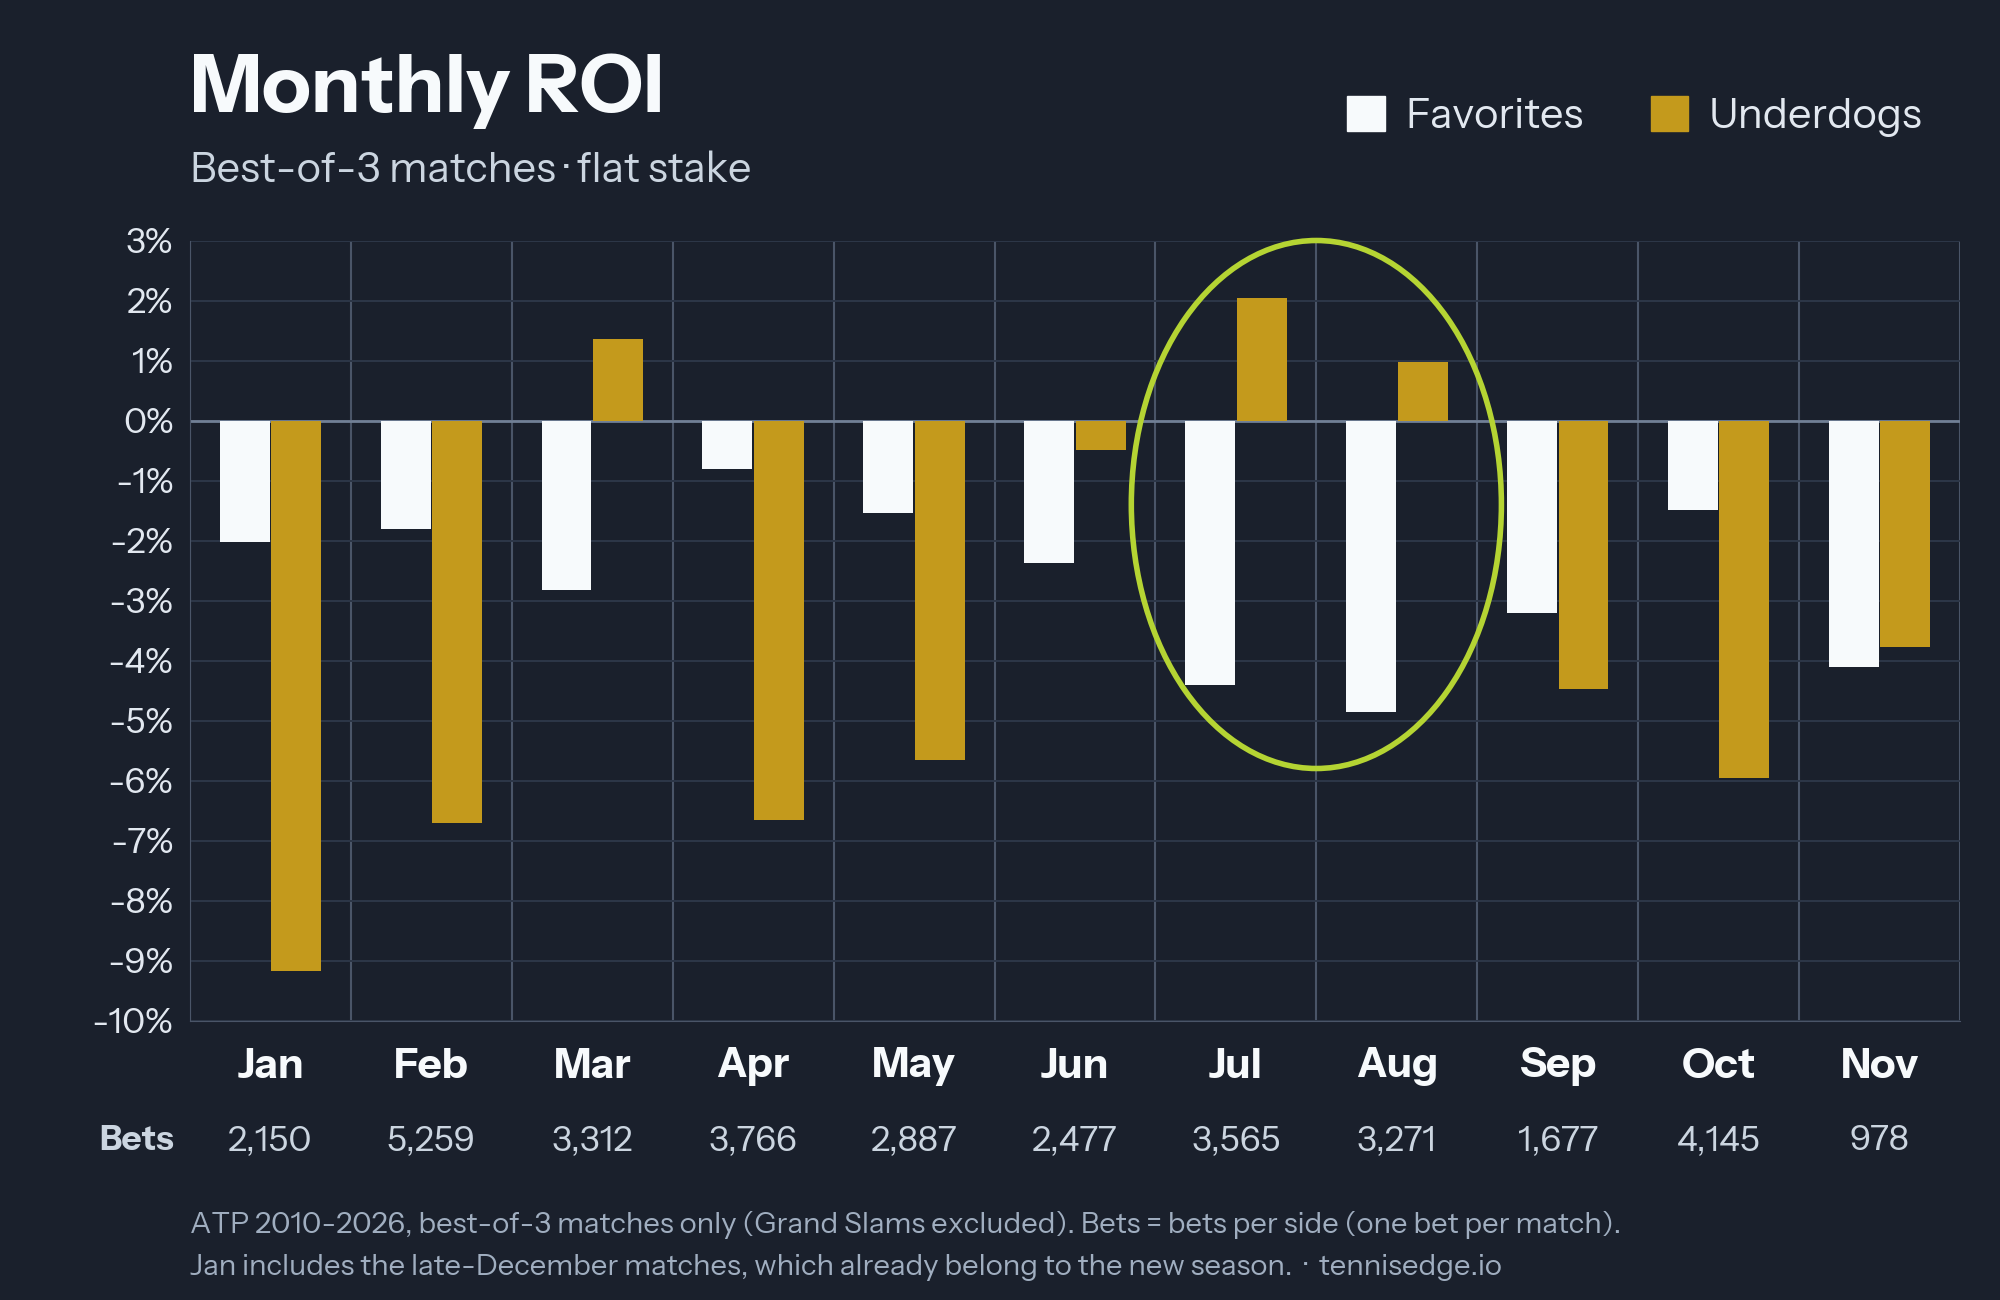
End of the season: nothing
September, October and November show nothing special. The market prices them well.
I also checked the Asian swing on its own (Beijing, Tokyo, Shanghai, Chengdu, Hangzhou...). In 2,067 matches, favorites won 68.8% of the time, and the odds said they should win 68.7%. Almost perfect.
But July and August are different
July and August are the only months, together with March, where underdogs have a positive ROI. And they are the two months where favorites do worst.
- July: underdogs +2.05%, favorites -4.40%
- August: underdogs +0.97%, favorites -4.85%
- Both months together (6,836 bets per side): underdogs +1.53%, favorites -4.61%
To see why this matters, compare it with the rest of the year. Outside July and August, underdogs return -4.8% and favorites -2.0%. Underdogs do worse than favorites, and that is normal: it is the favorite-longshot bias, the market puts more margin on the underdog side.
In summer this flips. Underdogs go from 2.8 points worse than favorites to 6.1 points better. That is a 9-point swing.
Is it just variance?
My first feeling was no, because the difference is big and the sample is big. But a feeling is not enough, so I ran the numbers:
- The 9-point swing is statistically significant.
- It is not one or two crazy seasons. July+August was worse for favorites than the rest of the year in 12 of the last 17 seasons.
- And 2026, a season I had not looked at before, went the same way. (ROI dogs: +7.8%, ROI favs: -6.9%)
Is it the heat?
That was my next idea: European summer, heat, more uncertainty. But summer depends on where you are. In January and February it is summer in Australia and South America, and there are ATP events there. If heat was the reason, we should see the same thing.
We don't. In the Australian and South American events of January and February (3,041 matches), underdogs return -4.5% and favorites -3.1%. The normal pattern.
Also, inside July and August the effect is strongest around the Canadian Masters and the start of Cincinnati, not in the hottest places.
So I don't think it is the heat. I think it is the calendar: the stretch between Wimbledon and the US Open. Top players change surface, manage their bodies, and have their heads in New York.
What does this mean for betting?
Be careful here. The +1.5% for underdogs is not a system. With this sample, the real number could be anywhere between about -2% and +5%. Blind betting on underdogs is roughly break even, not a gold mine.
Favorites are a different story, and here the data is much clearer. Blind betting on favorites in July and August returns -4.6%, more than double the loss of the rest of the year (-2.0%). Even in the best case, it stays clearly worse than normal. Summer favorites are a bad bet.
So for me the lesson is not to bet every underdog in July & August. It is to look at summer favorites with much more suspicion and caution.
Check it yourself
You can dig into the data in my app, FavOrDog. There is no month filter, but you can check any tournament one by one and filter by surface, round, odds and time period. You can also see how more than 500 ATP players perform as favorites and as underdogs.
There is a free option to get 12 months of access. All the details are at favordog.io.


